


QVC's Most Important Customer Count Metric That Nobody Talks About
Does the Market Even Know It Exists?
I’ve written about QVC at length on Seeking Alpha in the comments, and I thought I’d start this blog to put my thoughts in a more formal setting. I’m not in this for subscribers, but I do like putting my thoughts down, and having a blog gives me the incentive to do so. Plus, the long-form written word is a way better form of communication in my view.
QVC is a great business, and the common stock (A shares) is selling for less than half of what they generated in cash flow per share last year (and what future cash flow will most likely be), and because I believe earnings will go to share buybacks or dividends at some point in the future, I think we have a sensational investment opportunity. The market, however, is pricing QVC’s common stock as essentially worthless, either due to bankruptcy or because they believe management will focus on debt reduction forever—never rewarding shareholders—despite management’s clear guidance on their leverage targets and their decades-long history of rewarding shareholders.
I digress. The point of this post is customer counts, not the general QVC idea, so I’m going to assume you have followed the QVC story and have read at least some of my comments on it. Let talk customer counts.
The Correct Way to Think About QVC’s Customer Counts
I think David Rawlinson’s favorite word is “fundamental,” so I’m going to use it here.
It occurred to me recently that there is a fundamental misunderstanding in the market about QVC’s customer counts. I’ve seen a lot of commenters out there (both bullish and bearish on QVC) who tacitly do not understand the basics of how this business works (or other retailers for that matter). Let’s get back to basics, because it’s not the complicated stuff that gets you. It’s the simple stuff that you forgot about.
QVC’s existing customers have a current retention rate of 88%. This is a domestic QVC/HSN combined annual retention rate.
This means that QVC lost 12% of their existing customers this year. This is called churn.
In order to keep their existing customer counts stable, QVC needs to acquire 12% more existing customers to offset the existing customers that left. They do this through marketing and advertising, and it’s a key part of their business.
Let’s compare that to the retail industry at large. The average retention rate in retail is 63%. That means that QVC’s competitors need to acquire three times the number of customers per year than what QVC needs to acquire in order to keep their existing customer count stable. If that isn’t a competitive advantage, I don’t know what is.
What about new and reactivated customers? Their retention is 0%. Yes, it is 0%. Read this as many times as you can: QVC’s new and reactivated customers have 0% retention. I don’t know how many comments I’ve seen that contradict this basic truth.
A new customer who bought a QVC product last year and didn’t buy one this year is not in the customer count. And a new customer who buys a product this year and does buy a product next year is no longer a new customer, because they graduated to existing customers by buying in consecutive years. The same applies to reactivated customers. Once they make purchases in two consecutive rolling twelve-month periods, they cease to be reactivated customers and become existing. If they don’t buy a product in the following year, they are no longer in the customer count at all.
So when you see 1.8 million new customers and 1.9 million reactivated customers in the 2024 Q4 earnings presentation, you’re looking at 2.7 million completely different customers than the ones that were listed in the 2023 Q4. Those are different groups of people. I’ve seen comments suggest that QVC lost 100 thousand new customers in 2024 (about 1.9 million in Q4 2023 vs 1.8 million in Q4 2024). But that’s not what happened.
They lost 1.9 million customers and acquired 1.8 million customers. This is an extremely important distinction.
If they keep the new and reactivated customer counts stable (which they have), they have 2.7 million people that make up a customer pool that they can draw from to convert people to existing customers. And that is a pool of customers that refreshes every year.
This is what the business is all about—storytelling and marketing that creates strong emotional connections that translate into a small percentage of new and reactivated customers becoming repeat, high-spending, stable customers with industry-leading retention rates. The existing customer.
The question is: are they currently converting new and reactivated customers into existing customers?
Emphatically yes. Conversion is accelerating rapidly, and I can prove it. I have said in the past that you would know that the company has already turned around if you’re looking in the right places. Let’s actually go there.
Introducing NECs
Martin Whitman said that there is a tendency in investors to focus on what accounting figures are and not on what they mean. Many people today are making the same mistake with QVC’s customer counts.
Every year, they acquire a new pool of new and reactivated customers and attempt to pull some of them into the existing customer file. Since these new and reactivated customers buy products, the non-sticky customers help subsidize QVC’s advertising spend to acquire existing customers. With all of this in mind, it’s clear that they are important to QVC’s business, but they are not nearly as important as another customer classification, even more important than the existing customer count.
The most important metric is new existing customers. I call them NECs. These are the customers that became existing customers for the first time this year. QVC does not disclose this number, but we don’t need them to.
In the Investor Day presentation in November, we were told that retention is 88%. But let’s not focus on the numbers. Let’s focus on what they mean. Retention is a known quantity, so we should expect existing customers to decline each year, provided QVC is doing a good job maintaining retention (which they have; retention has been increasing).
Keeping retention is one component and acquiring NECs is the other, together being critical to the business’s long-term success. But I’d argue that NECs are more critical at this stage in the story. A 12% churn—even if it is industry leading—is still churn, and QVC will die if they don’t acquire NECs.
So, if retention is 88%, that means that if QVC acquired zero NECs, then existing customers must have been down 12% year over year.
But they weren’t.
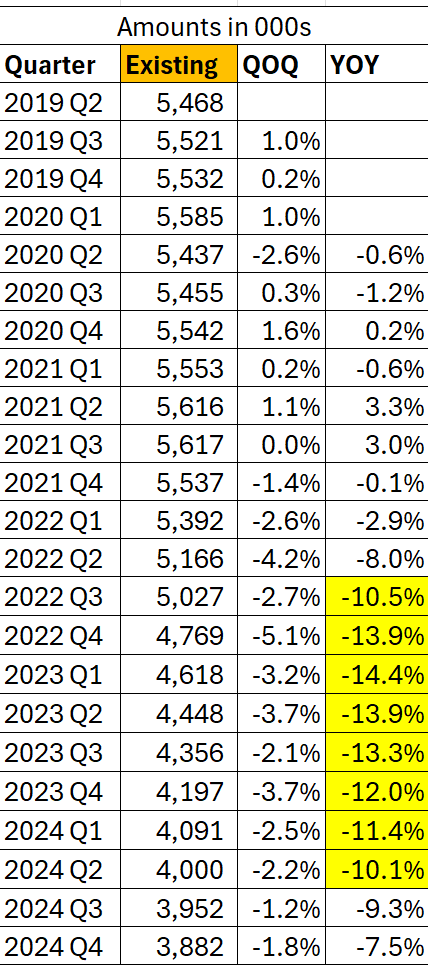
Existing customer counts were down 7.5%—the lowest year-over-year comparison since Q1 2022. The only logical way they are down 7.5% is if they acquired some NECs during the year. If the existing customer count declines less than the retention rate, you know they are getting more NECs. And on the flipside, if the count declines in an amount close to the churn rate, you’ve got marginal or no NECs acquired. In 2023, for example, they had 87% retention, but customer counts were down 12%, so pretty marginal in 2023.
We can get closer to NEC true counts if we want—but it’s not necessary. As long as the spread between churn and total customer count decline continues to grow, we know we have an increasing growth in NECs. But this is my blog, and I can do what I want, so let’s dig a little deeper.
The math we need is simple, and it’s a common formula used in the industry (EC stands for existing customers).
We are given both beginning and ending existing customer counts in investor presentations, and churn is merely 1 minus the retention rate. They also give us retention on occasion. If we really wanted to obsess with it, investor relations may provide the quarterly information, but I’d call that being anal-retentive. We have a sufficient amount of information to work with.
So with the information we have, we can compare prior year ECs to current year ECs, apply the churn rate from the investor presentation, and figure out how many NECs QVC acquired in 2024. The answer?
Somewhere between 170 thousand and 210 thousand (assuming retention is somewhere between 87.5% and 88.4%—they don’t round to the tenth in the presentation).
I can hear the naysayers now, “But that isn’t enough to replace all of the customers that left! Existing customer counts are still negative!”
But look at how drastically the existing customer counts were falling in the past! Think about what that implies about NEC acquisition.
In 2023, with retention at 87%, NECs were at most 70,000, and at worst they were 30,000. If you start looking at individual quarters, it’s pretty obvious that they were basically acquiring negligible amounts of NECs, if any, for many quarters starting in 2022.
So worst-case scenario, QVC has 2.5 times more new existing customers this year than last year. It may have been over 5 times. Framed differently, existing customer conversion has grown somewhere from 350% up to over 600% in the last year.
But that’s not even the half of it.
Driving It Home
When do you think these NECs were acquired?
Consider how existing customers are defined. A purchase in each of the last two years. These NECs were not acquired in 2024. They were acquired in 2023. They started out as new or reactivated customers in 2023 and then graduated to existing customers in 2024, but all of the work was done in 2023 to get them to buy the first time then the next time and the time after that.
NEC counts and total existing customers counts, because of their lag, don’t tell you about how QVC performed on customer conversion in that year. They tell you about the prior year. So 2023’s counts show 2022 performance, and 2024’s counts show 2023 performance. And the customer counts for existing customers that we will see in 2025 tell us about 2024, not 2025.
But that isn’t true for new and reactivated customers. There is no lag for those.
Again, let’s think about what this means. When looking at existing customers, particularly NEC growth, the 2024 NEC and total existing customer count needs to be understood in a 2023 context. In other words, the 2024 NEC count was acquired from the pool of new customers in 2023.
Let’s drive this home. New and reactivated customers taken together are the NEC pool, and that pool declined nearly 6% in 2023, and of that pool, they converted around 5% to existing customers. Despite the decline of their pool, NECs were up over 250% from 2022. They were converting less than 1% in 2022 on a larger pool.
And for 2024 our new and reactivated pool is down 3.6%, but we don’t know how many have been converted even though they have already been converted! But up until this year, the important measure has been extremely positive, and conversion after dropping to zero has dramatically turned around. In fact, NEC growth has skyrocketed since mid-2023, growing every quarter at a rapid pace on average. These figures are inexact as to timing, but exact quarterly figures are unimportant. The trend is what’s important. And that’s a damn positive trend.
The primary problem I’m seeing is the focus on new customer growth rates (I’ve focused too much on it myself). It’s not about new customer count growth rates. It’s about customer count stability and conversion to existing customers. That’s the business. If QVC’s marketing team figures out a more efficient way to convert NECs (this is hypothetical), new and reactivated customers can be declining while the business is growing. Don’t forget that existing customers are 90% of this business and increase their spend each year. They are the engine.
Because of this, the evidence points to existing customers being close to flat by the end of this year. Investing is about looking forward. Focusing on past growth rates doesn’t do anyone any good. Those figures are merely pieces of information we can use to make inferences about the future. Here’s another inference: if customers counts are flat, top line is up, because existing customers spend more every year.
But here go the naysayers again, “You’re just making up a metric to find something to be positive about. This is just confirmation bias!”
Is it? Are you telling me that acquiring additional existing customers from the pool of new and reactivated customers isn’t how this business works? Are you suggesting that they didn’t convert customers to existing additional customers in 2023? If they didn’t, where did the additional customers come from? The only other logical place would have to be that retention shot up to 92.5%, and if that’s the case, would that be a bad thing?
Here’s the rub.
When you are a contrarian who is correct, the crowd will believe you merely have rose-colored glasses on. Have you considered that the crowd is wearing dark-blue glasses?
Hi TJ, a few thoughts following a more careful review of your analysis. I agree with your conclusion that New Existing Customers (NECs) are trending upward, with a significant 294% increase from 48k in 2023 to 189k in 2024. The conversion rate of new and reactivated customers into existing customers has also improved, rising from 0% in 2022 to 1.2% in 2023, and reaching 4.9% in 2024 (189k NECs from a 2023 pool of 3,867k new + reactivated). This trend supports your prediction of near-flat existing customer counts by the end of 2025, as the YOY decline in existing customers has slowed from -12.0% in 2023 Q4 to -7.5% in 2024 Q4.
I also share your concern that the current NEC growth and conversion rates are not yet sufficient to fully offset the ongoing decline in existing customers. From 2023 Q4 to 2024 Q4, existing customers dropped by 315k (4,197k to 3,882k), while NECs added only 189k, resulting in a net loss of 126k. For a true business turnaround, I believe we need to see not only higher conversion rates but also a substantial increase in the pool of new and reactivated customers to fuel NEC growth and stabilize the existing customer base.
Historical Trends in New and Reactivated Customers
The pool of new and reactivated customers has been declining:
2021 Q4: 4,814k (2,568k new + 2,246k reactivated).
2022 Q4: 3,927k (1,982k new + 1,945k reactivated), a -18.4% YOY decline.
2023 Q4: 3,867k (1,965k new + 1,902k reactivated), a -1.5% YOY decline.
2024 Q4: 3,727k (1,920k new + 1,807k reactivated), a -3.6% YOY decline.
This downward trend in the new/reactivated pool limits the potential for NEC growth, despite improving conversion rates. For example, the 2023 pool (3,867k) converted 189k into NECs (4.9%), but a smaller 2024 pool (3,727k) would need a higher conversion rate (e.g., 8% to yield ~300k NECs) to offset the expected churn of 467k (12% of 3,882k). Achieving a large increase in new and reactivated customers—say, back to 2021 levels of 4,814k—would provide a larger base for conversion, potentially adding 235k NECs at the current 4.9% rate, which would nearly offset churn and stabilize counts.
Role of Streaming and Social Media
If QVC leverages streaming and social platforms to increase impressions and views, this could boost new and reactivated customer acquisition. The 2020–2021 period, with NECs at 829k and 628k respectively, coincided with heightened digital engagement during COVID-19, suggesting that similar strategies could work again. However, we don’t have specific metrics on viewership on streaming/social impact and its impact on customer counts and conversation rathes, other than the presentation on investor day 2024 that didn’t delve into the details.
Broader Turnaround Indicators
While NEC growth is a positive sign, I think a business turnaround also requires broader evidence beyond customer counts. Existing customers are increasing their spend (from $1.5k in 2022 to $1.65k in 2024, Q4 2024), and their purchase frequency rose to 32 items annually (up from 29 in 2022). This suggests that even with a declining base, revenue per customer is growing, which could mitigate top-line pressure. However, total revenue in Q4 2024 was $2.9B, down 6% YOY, indicating that customer count declines are still impacting overall performance.
Turnaround
To confirm a business turnaround, I’d propose the following:
Increase in New and Reactivated Customers: A return to 2021 levels (e.g., 4,800k total) to provide a larger pool for NEC conversion.
Sustained or Improved Conversion Rates: Maintaining or increasing the 4.9% rate to generate enough NECs (e.g., 300k+) to offset churn.
Stabilization of Existing Customers: Achieving flat or positive YOY growth in existing counts, as you predict for 2025.
Revenue Growth: Positive YOY revenue growth, leveraging the higher spend per existing customer.
In summary, your analysis of NECs and conversion rates is spot-on, and the 2025 prediction of near-flat counts is plausible if trends continue. However, I’d prioritize a significant increase in new and reactivated customers as the key driver for NEC growth, supported by digital initiatives like streaming and social media.
DATA:
2024 (Q4 2023 to Q4 2024):
Beginning EC (2023 Q4): 4,197k
Ending EC (2024 Q4): 3,882k
Retention: 88% (Churn: 12%)
Expected EC without NECs: 4,197k × 0.88 = 3,693k
Actual EC: 3,882k
NECs = 3,882k – 3,693k = 189k
2023 (Q4 2022 to Q4 2023):
Beginning EC (2022 Q4): 4,769k
Ending EC (2023 Q4): 4,197k
Retention: 87% (Churn: 13%)
Expected EC without NECs: 4,769k × 0.87 = 4,149k
Actual EC: 4,197k
NECs = 4,197k – 4,149k = 48k
2022 (Q4 2021 to Q4 2022):
Beginning EC (2021 Q4): 5,537k
Ending EC (2022 Q4): 4,769k
Retention: Assume 87% (Churn: 13%)
Expected EC without NECs: 5,537k × 0.87 = 4,817k
Actual EC: 4,769k
NECs = 4,769k – 4,817k = -48k
2021 (Q4 2020 to Q4 2021):
Beginning EC (2020 Q4): 5,642k
Ending EC (2021 Q4): 5,537k
Retention: Assume 87% (Churn: 13%)
Expected EC without NECs: 5,642k × 0.87 = 4,909k
Actual EC: 5,537k
NECs = 5,537k – 4,909k = 628k
2020 (Q4 2019 to Q4 2020):
Beginning EC (2019 Q4): 5,532k
Ending EC (2020 Q4): 5,642k
Retention: Assume 87% (Churn: 13%)
Expected EC without NECs: 5,532k × 0.87 = 4,813k
Actual EC: 5,642k
NECs = 5,642k – 4,813k = 829k
NEC Growth:
2023 to 2024: From 48k to 189k, a 294% increase.
2022 to 2023: From -48k (effectively 0k) to 48k, a significant jump but starting from a low base.
NECs were high in 2020 (829k) and 2021 (628k), reflecting strong conversion during the COVID-19 period, but dropped sharply in 2022.
Conversion Rates:
2023 Pool to 2024 NECs: 2023 new + reactivated = 1,965k + 1,902k = 3,867k. NECs in 2024 = 189k.
Conversion rate = 189k / 3,867k = 4.9%.
2022 Pool to 2023 NECs: 2022 new + reactivated = 1,982k + 1,945k = 3,927k. NECs in 2023 = 48k. Conversion rate = 48k / 3,927k = 1.2%.
2021 Pool to 2022 NECs: 2021 new + reactivated = 2,568k + 2,246k = 4,814k. NECs in 2022 = 0 (negative). Conversion rate = 0%.
something I find difficult for this investment is finding apples to apples comparison to get a rough industry value we should expect on this investment. what in your opinion should we use to help us: p/fcf of online retail companies? I think that would be a good start.